using DataFrames, RDatasets

iris = dataset("datasets", "iris");1 What is a dataframe?
A dataframe is a table (or a matrix) with some special restrictions that make it suited for data analysis. You can think of a dataframe as an array of vectors put side-by-side, all of which have the same length. Each column has a name.
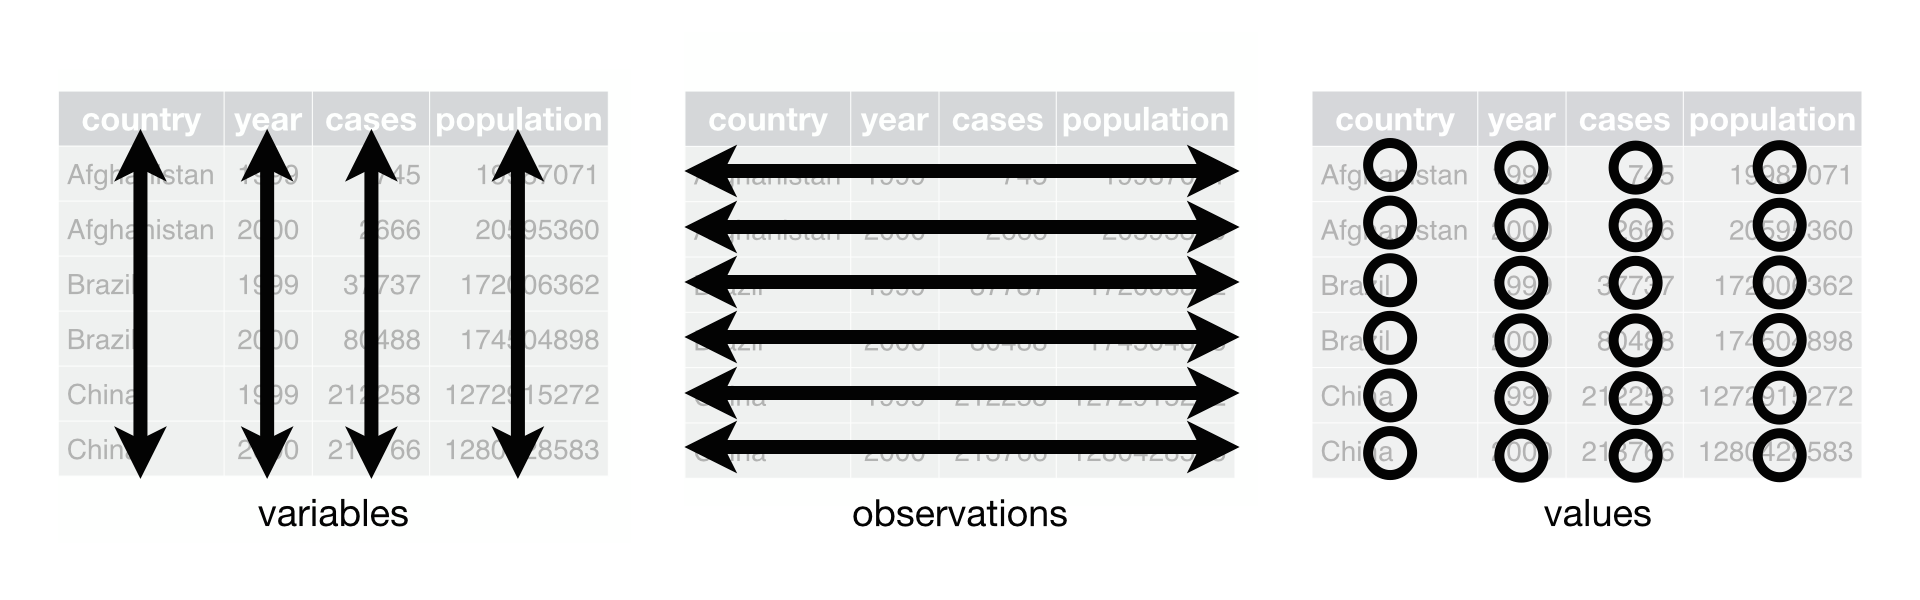
When a dataframe is tidy, each row is an observation and each column is a variable. See (Wickham, Çetinkaya-Rundel, and Grolemund 2023, chap. 5) for a detailed discussion on tidy data and its advantages.
We will always try to “tidy” a dataframe in order to use it.
Let’s load the classic iris dataset to get into details.
1.1 Basic manipulation of dataframes
You can print the dataframe by running the following:
iris150×5 DataFrame
125 rows omitted
| Row | SepalLength | SepalWidth | PetalLength | PetalWidth | Species |
|---|---|---|---|---|---|
| Float64 | Float64 | Float64 | Float64 | Cat… | |
| 1 | 5.1 | 3.5 | 1.4 | 0.2 | setosa |
| 2 | 4.9 | 3.0 | 1.4 | 0.2 | setosa |
| 3 | 4.7 | 3.2 | 1.3 | 0.2 | setosa |
| 4 | 4.6 | 3.1 | 1.5 | 0.2 | setosa |
| 5 | 5.0 | 3.6 | 1.4 | 0.2 | setosa |
| 6 | 5.4 | 3.9 | 1.7 | 0.4 | setosa |
| 7 | 4.6 | 3.4 | 1.4 | 0.3 | setosa |
| 8 | 5.0 | 3.4 | 1.5 | 0.2 | setosa |
| 9 | 4.4 | 2.9 | 1.4 | 0.2 | setosa |
| 10 | 4.9 | 3.1 | 1.5 | 0.1 | setosa |
| 11 | 5.4 | 3.7 | 1.5 | 0.2 | setosa |
| 12 | 4.8 | 3.4 | 1.6 | 0.2 | setosa |
| 13 | 4.8 | 3.0 | 1.4 | 0.1 | setosa |
| ⋮ | ⋮ | ⋮ | ⋮ | ⋮ | ⋮ |
| 139 | 6.0 | 3.0 | 4.8 | 1.8 | virginica |
| 140 | 6.9 | 3.1 | 5.4 | 2.1 | virginica |
| 141 | 6.7 | 3.1 | 5.6 | 2.4 | virginica |
| 142 | 6.9 | 3.1 | 5.1 | 2.3 | virginica |
| 143 | 5.8 | 2.7 | 5.1 | 1.9 | virginica |
| 144 | 6.8 | 3.2 | 5.9 | 2.3 | virginica |
| 145 | 6.7 | 3.3 | 5.7 | 2.5 | virginica |
| 146 | 6.7 | 3.0 | 5.2 | 2.3 | virginica |
| 147 | 6.3 | 2.5 | 5.0 | 1.9 | virginica |
| 148 | 6.5 | 3.0 | 5.2 | 2.0 | virginica |
| 149 | 6.2 | 3.4 | 5.4 | 2.3 | virginica |
| 150 | 5.9 | 3.0 | 5.1 | 1.8 | virginica |
For each flower (row) there are 4 measurements (length and width of sepal and petal), along with the corresponding species. This dataframe is tidy because each row is an observation (a flower) and each column is a measurement of the same flower. This is the best scenario for a dataset, and you won’t always be so lucky.1
You can see a lot of useful information in the print above:
- There are 150 rows and 5 columns (the “150x5” part).
- The name and type of each column.
Speciesis a fancy “150-element CategoricalArrays.CategoricalArray{String,1,UInt8}”. - A counting of rows on the left.
1.1.1 Columns
There are several ways to “extract” a column in the form of a vector; all the below result in the same:
iris.PetalLength;
iris[!, 1];
iris[!, "PetalLength"];
iris[!, :PetalLength]
150-element Vector{Float64}:
1.4
1.4
1.3
1.5
1.4
1.7
1.4
1.5
1.4
1.5
1.5
1.6
1.4
⋮
4.8
5.4
5.6
5.1
5.1
5.9
5.7
5.2
5.0
5.2
5.4
5.1Important: these are views of the dataframe. If you modify a view, you also modify the dataframe. A view is just a shortcut to the dataframe.
To get a copy of the column, use
iris[:, 1];
iris[:, "PetalLength"];
iris[:, :PetalLength]
150-element Vector{Float64}:
1.4
1.4
1.3
1.5
1.4
1.7
1.4
1.5
1.4
1.5
1.5
1.6
1.4
⋮
4.8
5.4
5.6
5.1
5.1
5.9
5.7
5.2
5.0
5.2
5.4
5.1Views are faster to access than copies, so it depends on the use you are going to make. See the Dataframes.jl docs for more details.
If the column name is inside a variable, say my_column, then you can use the following:
# in case it is a string
my_column = "PetalLength";
iris[:, my_column];

# in case it is a symbol
my_column2 = :PetalLength;
iris[:, my_column2]
150-element Vector{Float64}:
1.4
1.4
1.3
1.5
1.4
1.7
1.4
1.5
1.4
1.5
1.5
1.6
1.4
⋮
4.8
5.4
5.6
5.1
5.1
5.9
5.7
5.2
5.0
5.2
5.4
5.1Symbols are a little faster to access compared to string, but special strings can’t be turned into symbols.
As an example of the “copy vs. view” behaviour, let’s modify the first row and set the SepalLength to 999. The copy approach won’t work:
iris[:, "PetalLength"][1] = 999;
iris
150×5 DataFrame
125 rows omitted
| Row | SepalLength | SepalWidth | PetalLength | PetalWidth | Species |
|---|---|---|---|---|---|
| Float64 | Float64 | Float64 | Float64 | Cat… | |
| 1 | 5.1 | 3.5 | 1.4 | 0.2 | setosa |
| 2 | 4.9 | 3.0 | 1.4 | 0.2 | setosa |
| 3 | 4.7 | 3.2 | 1.3 | 0.2 | setosa |
| 4 | 4.6 | 3.1 | 1.5 | 0.2 | setosa |
| 5 | 5.0 | 3.6 | 1.4 | 0.2 | setosa |
| 6 | 5.4 | 3.9 | 1.7 | 0.4 | setosa |
| 7 | 4.6 | 3.4 | 1.4 | 0.3 | setosa |
| 8 | 5.0 | 3.4 | 1.5 | 0.2 | setosa |
| 9 | 4.4 | 2.9 | 1.4 | 0.2 | setosa |
| 10 | 4.9 | 3.1 | 1.5 | 0.1 | setosa |
| 11 | 5.4 | 3.7 | 1.5 | 0.2 | setosa |
| 12 | 4.8 | 3.4 | 1.6 | 0.2 | setosa |
| 13 | 4.8 | 3.0 | 1.4 | 0.1 | setosa |
| ⋮ | ⋮ | ⋮ | ⋮ | ⋮ | ⋮ |
| 139 | 6.0 | 3.0 | 4.8 | 1.8 | virginica |
| 140 | 6.9 | 3.1 | 5.4 | 2.1 | virginica |
| 141 | 6.7 | 3.1 | 5.6 | 2.4 | virginica |
| 142 | 6.9 | 3.1 | 5.1 | 2.3 | virginica |
| 143 | 5.8 | 2.7 | 5.1 | 1.9 | virginica |
| 144 | 6.8 | 3.2 | 5.9 | 2.3 | virginica |
| 145 | 6.7 | 3.3 | 5.7 | 2.5 | virginica |
| 146 | 6.7 | 3.0 | 5.2 | 2.3 | virginica |
| 147 | 6.3 | 2.5 | 5.0 | 1.9 | virginica |
| 148 | 6.5 | 3.0 | 5.2 | 2.0 | virginica |
| 149 | 6.2 | 3.4 | 5.4 | 2.3 | virginica |
| 150 | 5.9 | 3.0 | 5.1 | 1.8 | virginica |
but with view, it works as expected:
iris.SepalLength[1] = 999;
iris
150×5 DataFrame
125 rows omitted
| Row | SepalLength | SepalWidth | PetalLength | PetalWidth | Species |
|---|---|---|---|---|---|
| Float64 | Float64 | Float64 | Float64 | Cat… | |
| 1 | 999.0 | 3.5 | 1.4 | 0.2 | setosa |
| 2 | 4.9 | 3.0 | 1.4 | 0.2 | setosa |
| 3 | 4.7 | 3.2 | 1.3 | 0.2 | setosa |
| 4 | 4.6 | 3.1 | 1.5 | 0.2 | setosa |
| 5 | 5.0 | 3.6 | 1.4 | 0.2 | setosa |
| 6 | 5.4 | 3.9 | 1.7 | 0.4 | setosa |
| 7 | 4.6 | 3.4 | 1.4 | 0.3 | setosa |
| 8 | 5.0 | 3.4 | 1.5 | 0.2 | setosa |
| 9 | 4.4 | 2.9 | 1.4 | 0.2 | setosa |
| 10 | 4.9 | 3.1 | 1.5 | 0.1 | setosa |
| 11 | 5.4 | 3.7 | 1.5 | 0.2 | setosa |
| 12 | 4.8 | 3.4 | 1.6 | 0.2 | setosa |
| 13 | 4.8 | 3.0 | 1.4 | 0.1 | setosa |
| ⋮ | ⋮ | ⋮ | ⋮ | ⋮ | ⋮ |
| 139 | 6.0 | 3.0 | 4.8 | 1.8 | virginica |
| 140 | 6.9 | 3.1 | 5.4 | 2.1 | virginica |
| 141 | 6.7 | 3.1 | 5.6 | 2.4 | virginica |
| 142 | 6.9 | 3.1 | 5.1 | 2.3 | virginica |
| 143 | 5.8 | 2.7 | 5.1 | 1.9 | virginica |
| 144 | 6.8 | 3.2 | 5.9 | 2.3 | virginica |
| 145 | 6.7 | 3.3 | 5.7 | 2.5 | virginica |
| 146 | 6.7 | 3.0 | 5.2 | 2.3 | virginica |
| 147 | 6.3 | 2.5 | 5.0 | 1.9 | virginica |
| 148 | 6.5 | 3.0 | 5.2 | 2.0 | virginica |
| 149 | 6.2 | 3.4 | 5.4 | 2.3 | virginica |
| 150 | 5.9 | 3.0 | 5.1 | 1.8 | virginica |
1.2 Libraries
1.2.1 Dataframes
Dataframes is the main package for dealing with dataframes in Julia. It defines the DataFrame type and all the important operations. It is fast and flexible enough for most cases. In order to manipulate dataframes in a more “easier” fashion, we also have 2 main alternatives: DataFramesMeta and TidierData.
1.2.2 DataFramesMeta
DataFramesMeta is a collection of macros based on DataFrames. It provides many syntatic helpers to slice rows, create columns and summarise data.
1.2.3 TidierData
Tidier is collections of libraries inspired by the tidyverse ecosystem in R. TidierData is the main package (analogous to R’s dplyr). It uses macros to rewrite your code into DataFrames.jl code. Because of this “tidy” heritance, we will often talk about the R packages that inspired the Julia ones (like dplyr, tidyr, purrr and many others).
In this book, whenever possible, we will show the different approaches in a tabset so you can compare them, giving more emphasis on Tidier.
1.3 Operations
Let’s start with some unary operations, ie. operations that take only one dataframe as input and return one dataframe as output.2. We can divide these operations in some categories:
1.3.1 Row operations
These are operations that only affect rows, leaving all columns untouched.
Filtering or subsetting is when we select a subset of rows based on some criteria. Example: all male penguins of species Adelie. The output is a dataframe with the exact same columns, but possibly fewer rows.
Arranging or ordering is when we reorder the rows of a dataframe using some criteria.
1.3.2 Column operations
These are operations that only affect columns, leaving all rows untouched.
Selecting is when we select some columns of a dataframe, while keeping all the rows. Example: select the
speciesandsexcolumns.Mutating or transforming is when we create new columns. Example: a new column
body_mass_kgcan be obtained dividing the columnbody_mass_gby 1000 for each entry.
1.3.3 Reshaping operations
These operations change the shape of a dataframe, making it wider or longer.
WideningLongering?
1.3.4 Grouping operations
- Grouping is when we split the dataframe into a collection (array) of dataframes using some criteria. Example: grouping by
Speciesgives us 3 dataframes, each with only one species.
1.3.5 Summary operations
These operations can possibly change rows and columns at the same time.
- Distinct;
- Counting;
- Summarising or combining is when we apply some function to some columns in order to reduce the amount of rows with some kind of summary (like a mean, median, max, and so on). Example: for each
species, apply themeanfunction to the columnsbody_mass_g. This will yield a dataframe with 3 rows, one for each species. Summarising is usually done after a grouping, so the summary is calculated with relation to each of the groups.
??? deixar grupo e sumário juntos?
Since all these functions return a dataframe (or an array of dataframes, in the case of grouping), we can chain these operations together, with the convention that on grouped dataframes we apply the function in each one of the groups.
Now for binary operations (ie. operations that take two dataframes), we have all the joins:
- Left join;
- Right join;
- Inner join;
- Outer join;
- Full join.
1.4 Comparing Tidier with DataFramesMeta
The following table list the operations on each package:
| dplyr | Tidier | DataFramesMeta | DataFrames |
|---|---|---|---|
filter |
@filter |
@subset / @rsubset |
subset |
arrange |
@arrange |
@orderby / @rorderby |
sort! |
select |
@select |
@select |
array sintax |
mutate |
@mutate |
@transform / @rtransform |
array sintax |
group_by |
@group_by |
@groupby |
groupby |
summarise |
@summarise |
@combine |
combine |
It is clear that for those coming from R, Tidier will look like the most natural approach.
Notice that we have a name clash with @select: that is why we usually write import DataFramesMeta as DFM at the beginning.
We will see each operation with more details in the following chapters.
1.5 Chaining operations
We can chain (or pipe) dataframe operations with the @chain macro:
using TidierData

@chain iris begin
    @filter !ismissing(Species)
    @group_by Species
    @summarise mean = mean(SepalLength)
    @arrange mean
end
Each row uses the results of the previous row as the input for the first argument of the current function. We will see more details later.
1.6 Using variables as column names
In Tidier, using the column names as if they were variables in the environment leads to some complication when we want to use other variables that are not column names.
For example, suppose you want to arrange penguins by a column that is stored in a variable.
When this happens, we add @eval before the Tidier code and add a $ to force evaluation of the variable, as in the following example:
my_arrange_column = :body_mass_g;

@eval @arrange penguins $my_arrange_column